A trip for a Mexican Beach.
Me and my friend were wonthering if sublet an apartments/houses and then put it for a short rental was a good idea?
This is a complex question to answer. We have so many variable to rely on and we want to know how much can we allow to rent a house?
During the pandemic people had more time to travel due to Home Office (HO) so we choose a city call Acapulco and big cities will provide most of our custumer (Mexico City and Puebla).
The problem was that we do not have enogh data to make good decitions. So I put my data skills to the work.
Working_data.
First we need some data. We purchase the data base of the city in https://www.airdna.co/ this platform already had some dashboard that you can work with but I really want to improve my data skills.
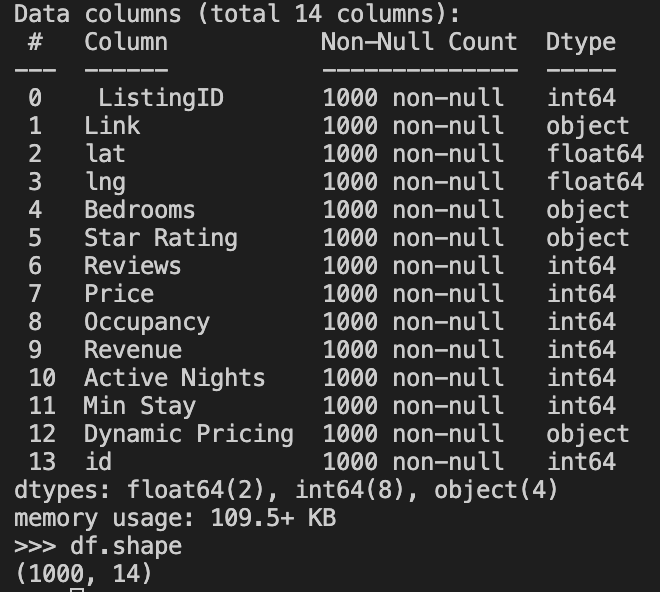
The file come in a CSV file I uploaded to Python and this was the starting data:
Columns definitions
So we have a table with 1,000 records and 14 columns. We have lat and log coordenate of the apartement, the number of bedrooms, Star Raitings that measure the service someone give to the guests, number of reviews, the average price per night, the occupancy in a percenteage, the anual revenue, active nights is the number of nights was availabel in 365 days.
Note: We talk with the sales team of this business they don’t get their data from Airbnb but they scrape it so the fidelity might not be the best one.
Cleaning and validate Data
I’m going to change the data type of lan and long the work more as a str that a float.
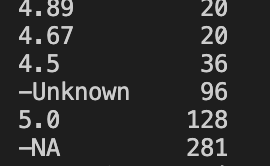
Star Raiting column had some “-NA” & “-Unknonwn” values I replace it with nan and change the type to float.
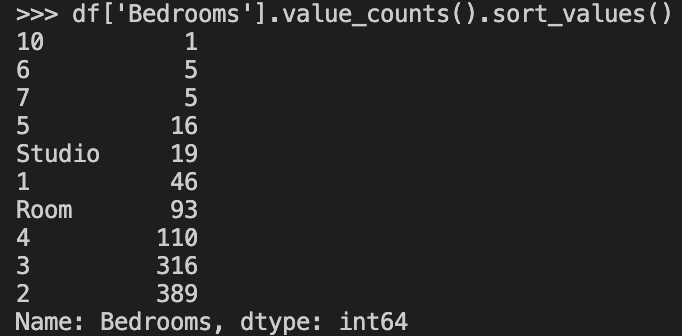
Beedrooms I analize from the 1,000 how was the distribution:
I want to know if the bedrooms with 1, Studio and Room behave in similar way. I boxplot these three option.
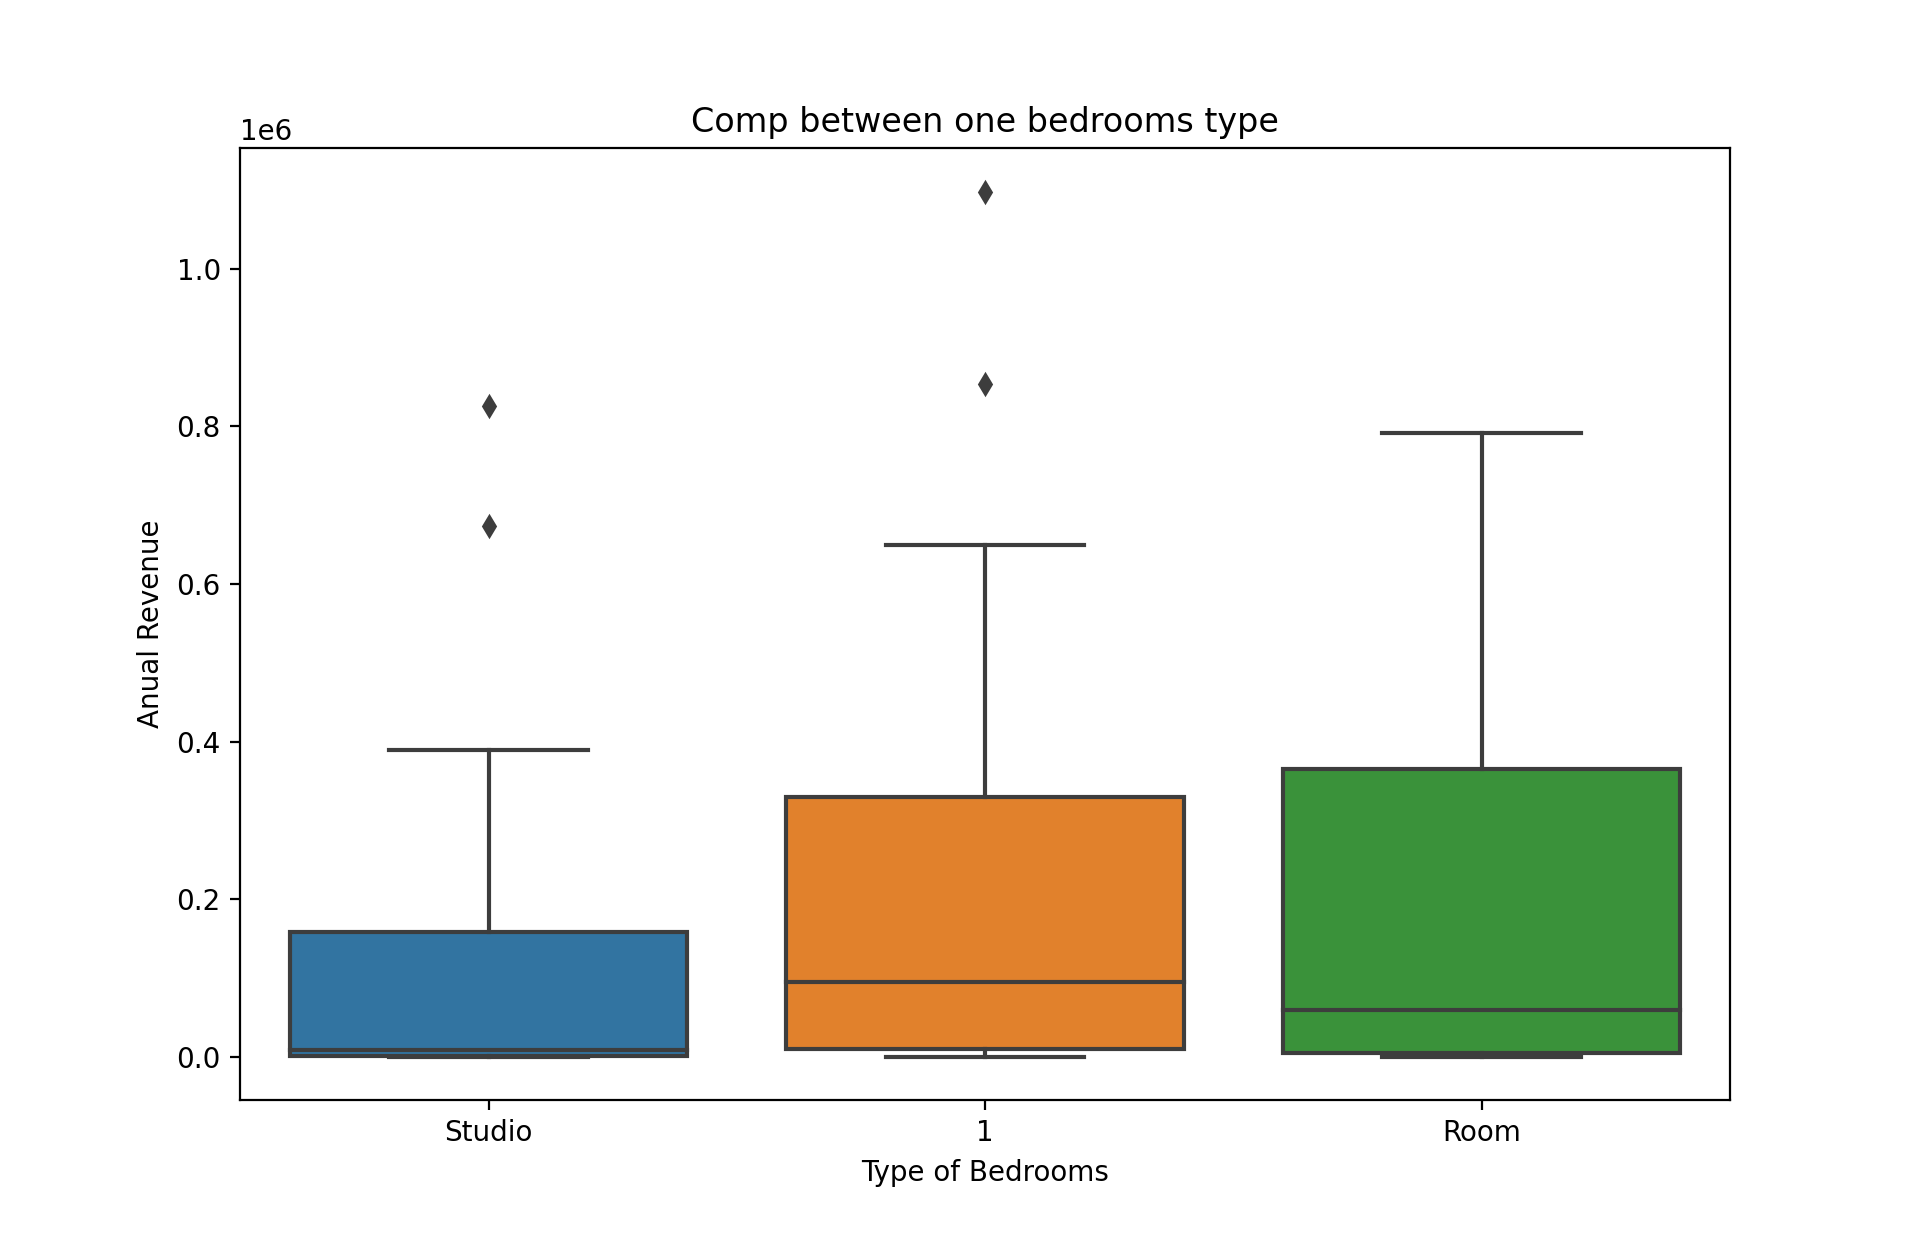
In this graph I merge Room label with “1”
I clean the table from the next values.
Revenue is nan or 0, Occupancy is 0. If bedrooms is equal to 10,6 and 7.
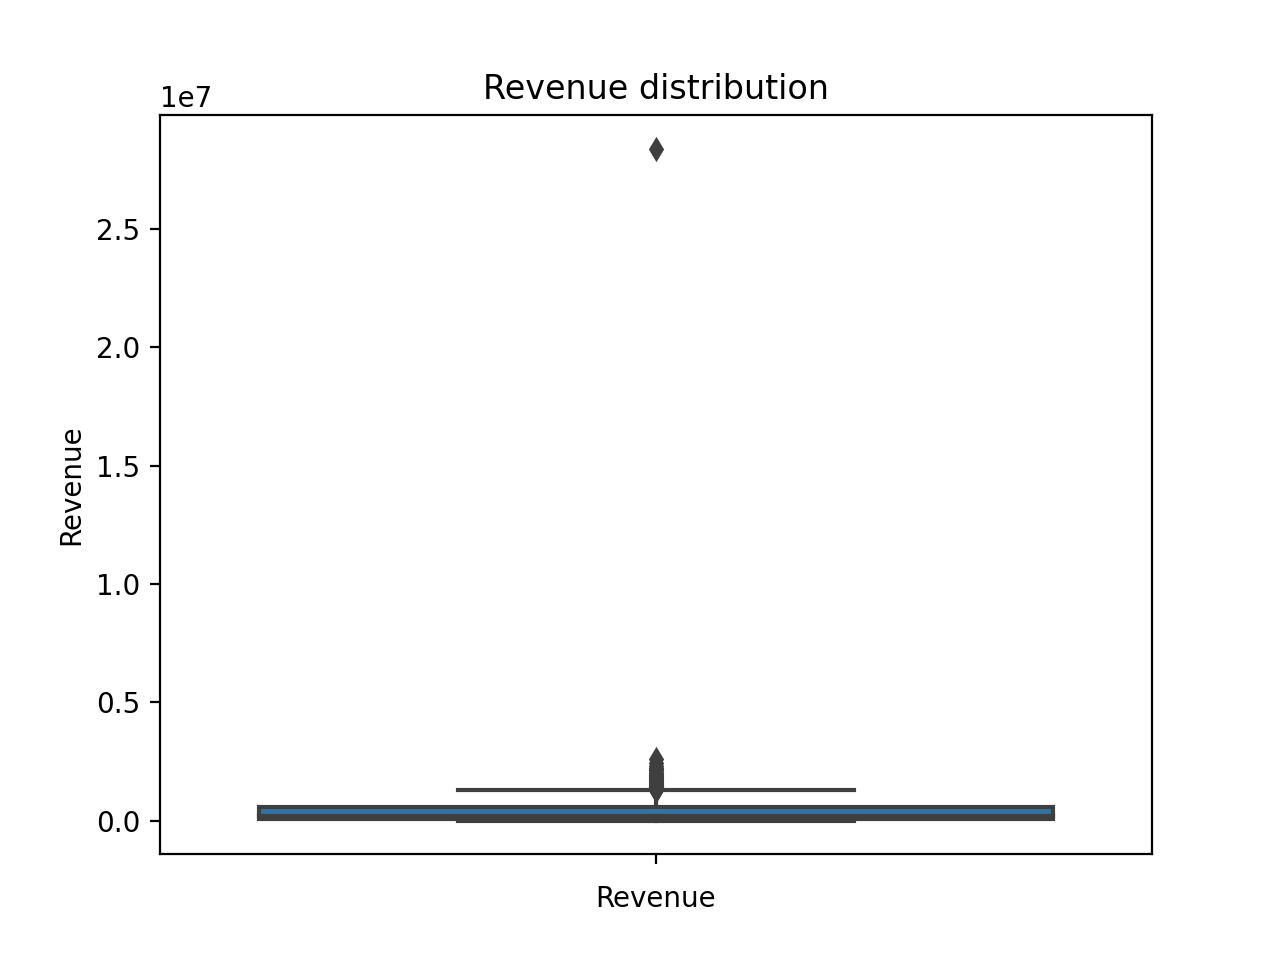
I also remove some outliers from revenue:
Final data set
After doing these changes we have the next DataFrame to work with.
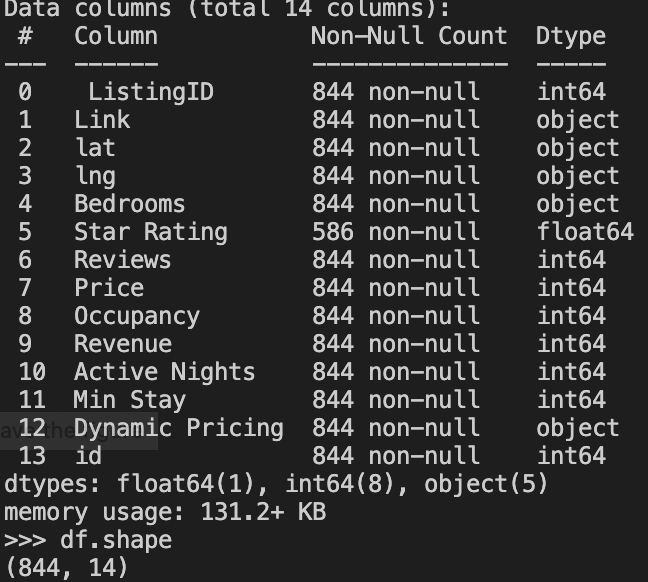
We lost 156 data points that for the data size of our sample is consider.
Let’s work some insights
I cross the variable Revenue and Bedooms to visualize IQR from each group
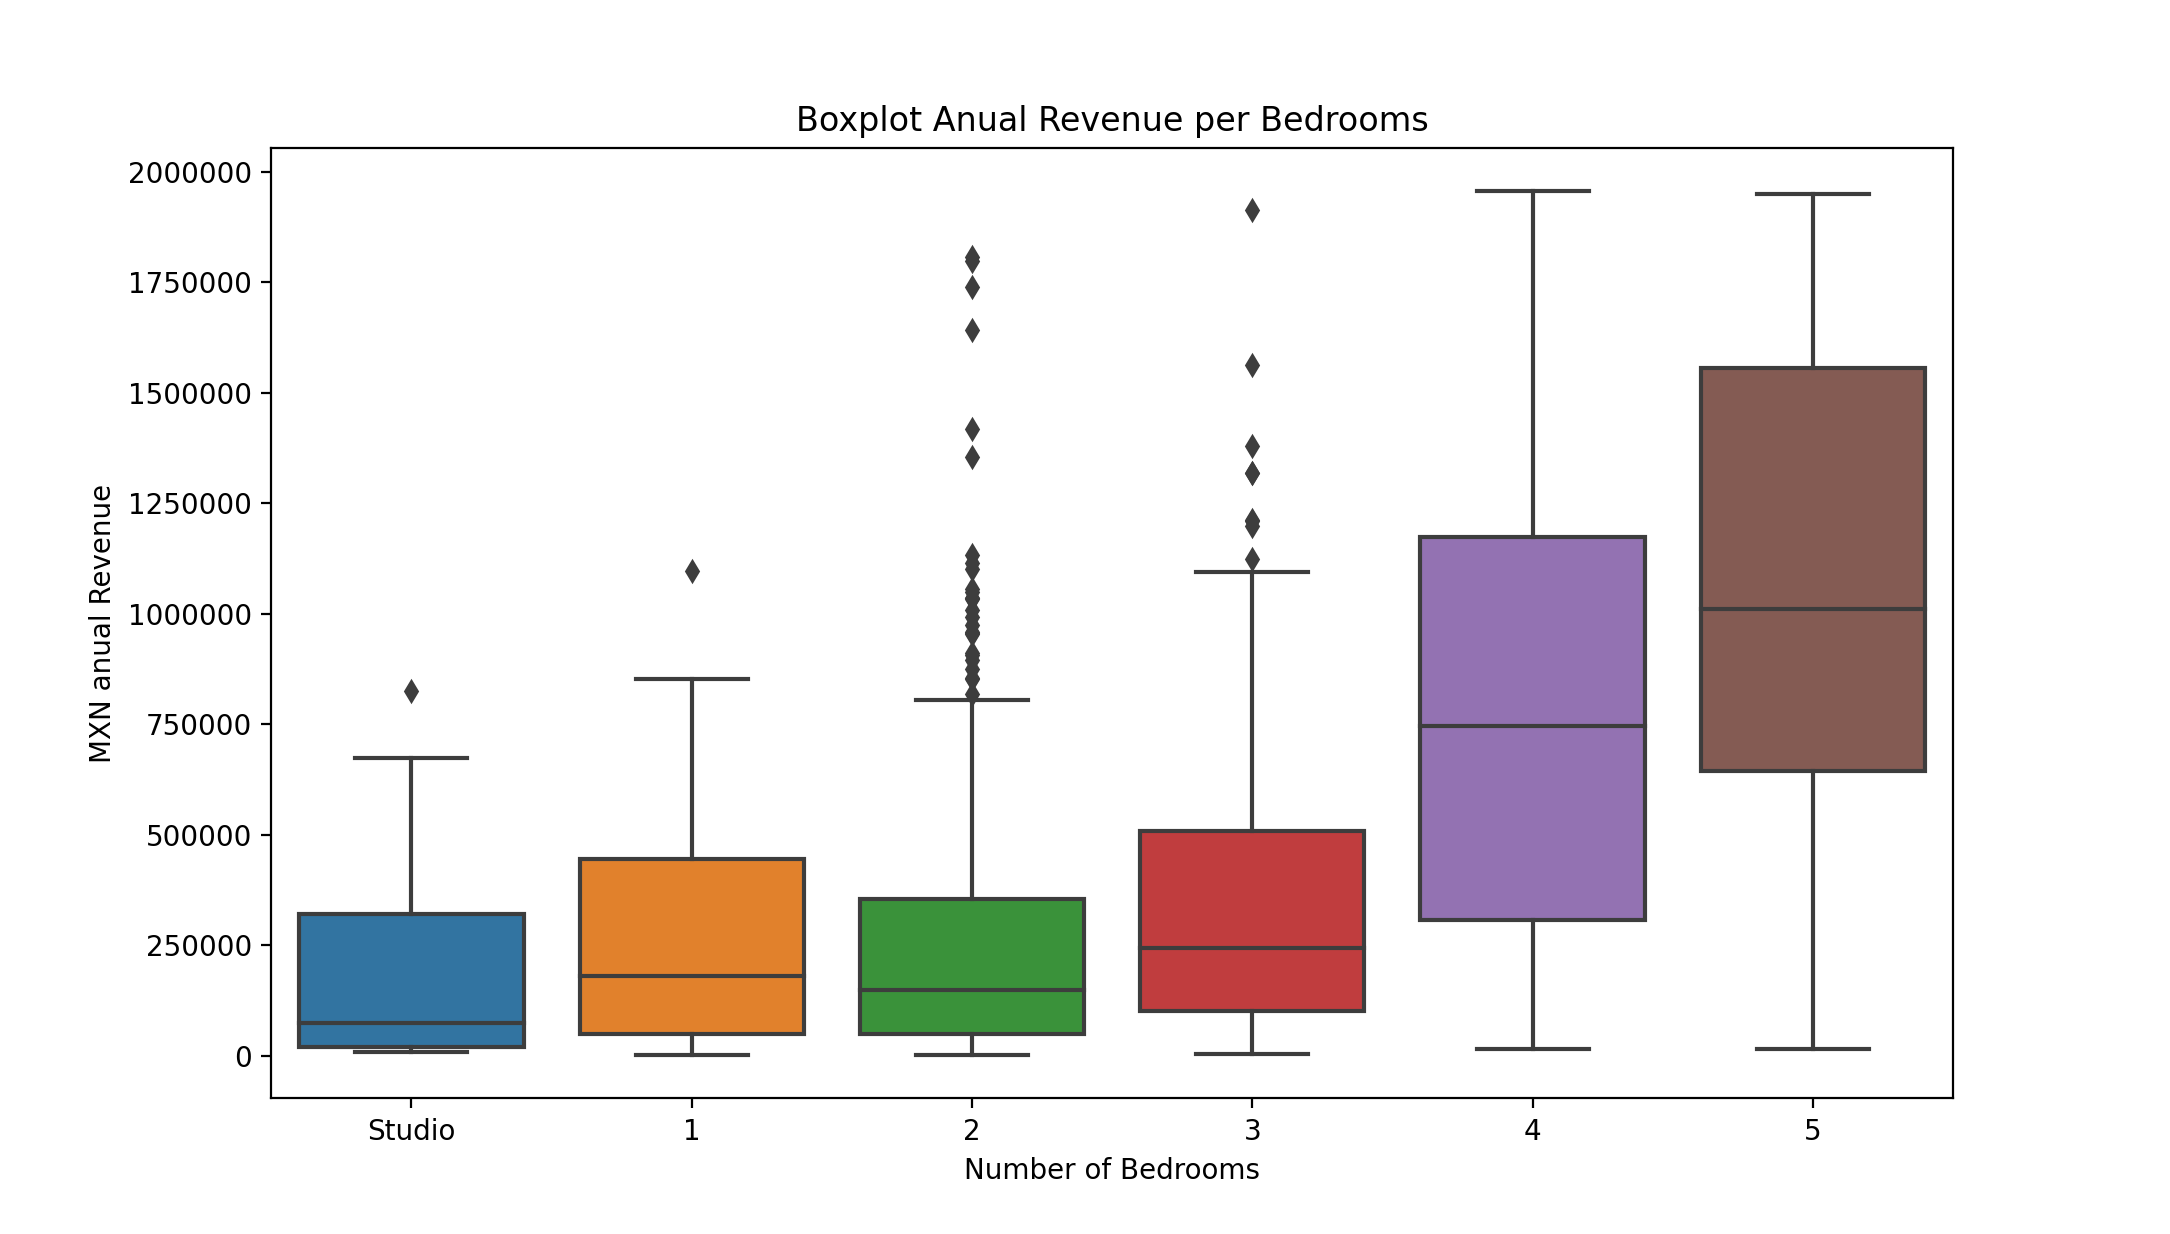
From this perspective the median of one bedroom apartment slighty higher than two bedroom althoug this one has a lot of outliers that generate higher revenue. Four and five bedroom are higher in revenue probably for the number of people that can fit. Don’t forget these apartments have bigger cost (utilities and maitance).
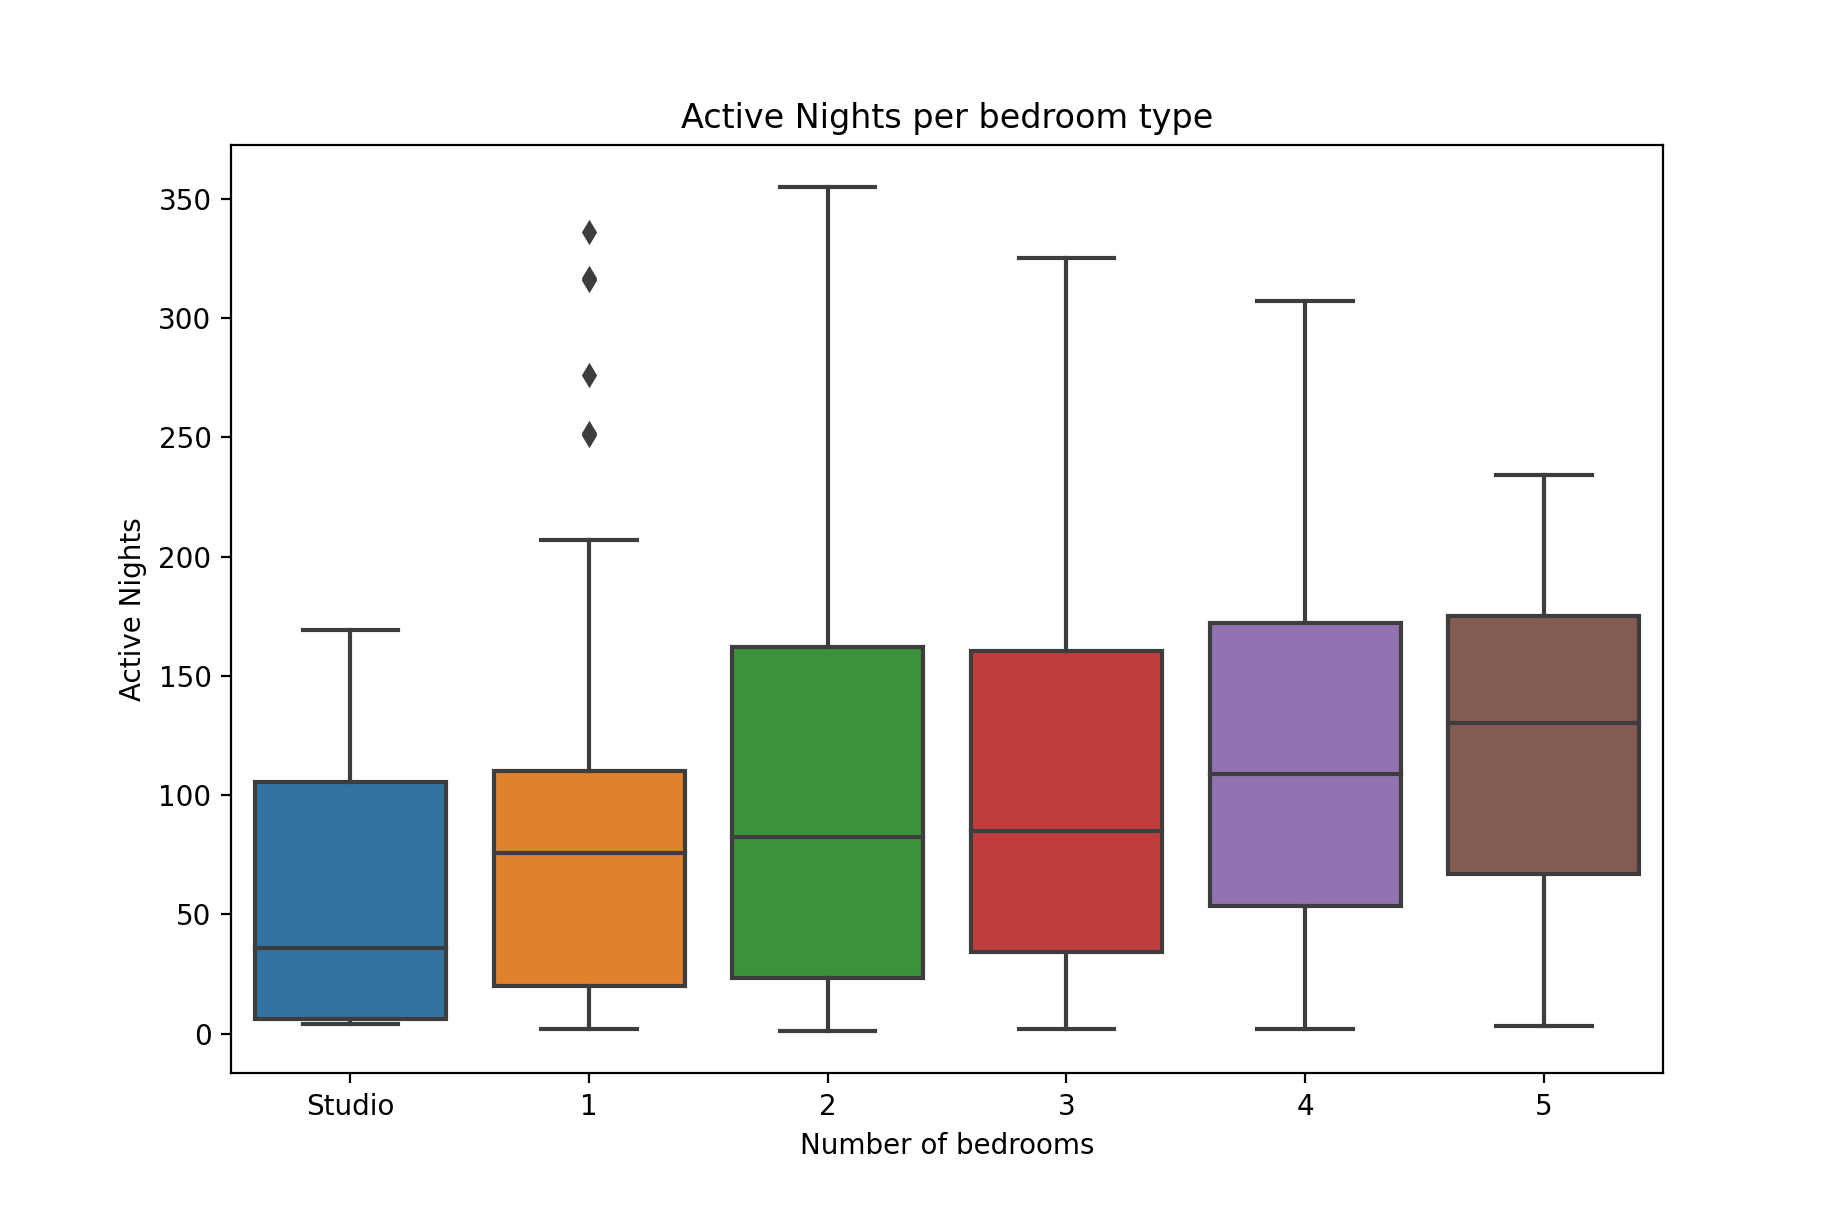
This graph help us to understand the dispertion and the availabity of each type of apartment. Relative new to the platform with a median for two and three bedroom be at 82 and 84 nights available respectivly.